Risk & Return in Multifamily Investment: Cap Rates
The capitalization rate, commonly known as a “cap rate,” is the standard measure of expected return within the world of multifamily investment. A cap rate is an important indicator of performance potential because it factors in both the asset’s price and the net income generated by that asset. As an industry-standard, cap rates allow clear comparisons over time between different geographies and asset types. Cap rates also allow us to test one of the basic tenets of investment theory and answer the question, “Do multifamily investors receive greater returns for greater risk?” Here, we’ll define the historical relationship between risk and return within multifamily through the lens of cap rates and establish expectations for the future of multifamily returns.
Subscribe now for more CONTI insights
Asset Risk in Multifamily
Asset risk in multifamily is a function of an individual property’s location within a neighborhood and the physical qualities of that property. To easily compare asset risk, multifamily professionals categorize properties using three asset classes. “Class A” assets are typically located in favorable neighborhoods, and are newly constructed or thoroughly renovated with luxurious unit interiors and amenities. “Class B” assets are usually located in nondescript areas, are older construction, and have modest unit interiors and amenities. “Class C” assets are typically located in less-desirable locations, are often in poor physical condition with respect to age, and have mediocre unit interiors and amenities. With increasing asset risk from Class A to Class C also comes rising cap rates. In 2019, commercial real estate brokerage and advisory firm CBRE reported that Class A assets within the U.S. transacted at an average cap rate of 4.99 percent, Class B transacted at an average of 5.37 percent, and Class C at an average 6.10 percent. With increasing asset risk from Class A to Class C investments, these cap rates show a 1.11 percent risk premium and support the general theory of a linear relationship between risk and return.
Location Risk in Multifamily
While neighborhood location is a component within asset risk, we allocate location risk to the economic health of specific cities or markets. Markets with a diverse, large, and growing employment base, like Dallas-Fort Worth, are inherently less risky than markets with a declining population, like Pittsburgh, Pennsylvania, or markets with a high concentration of employment within one sector, like the tourism-dependent economy of Las Vegas. Historically, multifamily investors consider the six “Major Metros” of New York, Boston, Chicago, Washington, D.C., Los Angeles, and San Francisco as the least risky American multifamily markets due to their robust populations and diverse employment bases. Opposite Major Metros in the risk model are “Tertiary” markets, or small markets with less than 1.5 million people, and typically require a significant risk premium for investors. The following figure illustrates this premium over the past two decades in the U.S. multifamily market.
According to Real Capital Analytics, since 2001, cap rates within small Tertiary markets average 1.3 percent greater than the Major Metros. Generally, greater location risk requires greater returns. However, the assumption of a linear relationship between location risk and return does not always hold. In the past ten years, the population growth rates within the Major Metros have significantly declined and even turned negative, as is the case for New York, Los Angeles, and Chicago during recent years. Despite these worrying fundamentals for multifamily demand, the risk premium between the Major Metros and Tertiary Markets appeared steady. By the end of 2019, the capital market’s slow reaction to this apparent mismatch between risk and return became evident. According to data provider Real Capital Analytics, prices in Non-Major metros increased 11.2 percent for the year, while prices in Major Metros only increased 3.9 percent. Over the next decade, CONTI expects investors to continue favoring Non-Major metros, specifically throughout the southern U.S., as the capital market responds to shifting location risk expectations.

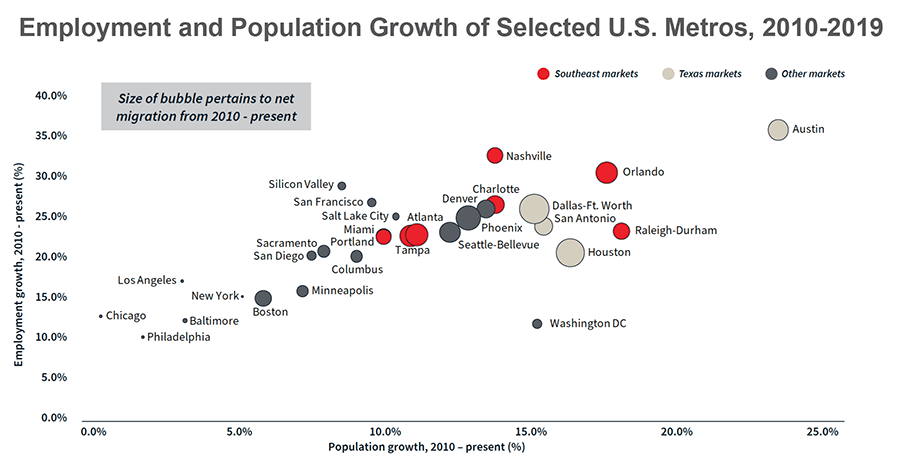
Despite the market disruptions of 2020, multifamily cap rate data suggest that expectations for future returns remain stable. According to CBRE, the average U.S. multifamily cap rate decreased in the second quarter of 2020 as investors exhibited confidence in the multifamily market’s stability. Over the long-term, we expect cap rates to continue their decadal trend of compression, as seen in Figure 1. Markets with outsize returns relative to their historically perceived location risk are poised for accelerating cap rate compression as well. For example, the Texas metros of Austin, San Antonio, Houston, and Dallas-Fort Worth display some of the most robust population and employment growth figures over the past decade, but pricing has yet to fully adjust for this shift in location risk. Since 2001, the Tertiary Markets required only a 0.3 percent risk premium relative to the Texas metros. Today, this historically low-risk premium is widening dramatically as Texas metros receive increasing attention from the capital market.
While Texas still exhibits outsize returns relative to location risk, the cap rate spread between the assumed “least risky” Major Metro markets is beginning to close. From 2015 to 2019, cap rates in the Major Metros increased by 0.03 percent, while cap rates in Texas declined by 0.69 percent over the same period. Exorbitant housing prices, increasing regulatory pressure, and a new cultural acceptance of remote work due to the pandemic have only accelerated the rising location risk of the Major Metros. For multifamily investors seeking to take advantage of mismatched returns relative to location risk in markets like Texas, there is no greater opportunity than the present.
The Savvy Investor’s Guide for Cap Rate Analysis
When making comparisons between assets and locations over time, the calculation of cap rates must remain consistent. Unfortunately, cap rates are often calculated inconsistently across the multifamily industry and make comparisons difficult. By recognizing some of the common forms of cap rate reporting and the incentives behind that reporting, multifamily investors can make better investment decisions. Here, we’ll describe three common cap rate calculations, beginning with the most frequently reported calculation: the “Acquisition” Cap Rate.
The Acquisition Cap Rate
The Acquisition Cap Rate is calculated by dividing the trailing twelve-month net operating income (NOI) of an asset by the purchase price of an asset. For example, a property with an NOI of $1,000,000 and a purchase price of $20,000,000 has an acquisition cap rate of 5 percent. While this is the simplest cap rate calculation and the most commonly used, the Acquisition Cap Rate does not reflect the buyer’s additional costs associated with an asset’s purchase. The “All-In” Cap Rate reflects these costs.
The All-In Cap Rate
The All-In Cap Rate is calculated by dividing the trailing twelve-month NOI of an asset by the purchase price along with all additional costs of purchase, or the total all-in cost of purchase. Additional costs of purchase often include taxes, lender fees, land assessments, legal fees, and other miscellaneous costs. These additional costs can easily amount to 5 percent of the asset’s purchase price for multifamily transactions. In the table below, an additional cost of $1,000,000 brings the total cost of purchase to $21,000,000 for our example asset. Consequently, the all-in cap rate for this asset is 0.24 percent below the acquisition cap rate. While the All-In Cap Rate better reflects reality for the purchaser, the “Proforma” Cap Rate provides the most comprehensive valuation of an asset.

The Proforma Cap Rate
The key differentiation between the Proforma Cap Rate and the Acquisition and All-In Cap Rates is that the Proforma Cap Rate includes expectations of future NOI and capital expenditure during the first year after purchase. Multifamily buyers reasonably expect to inject capital into a newly purchased asset to cure deferred maintenance and increase the property’s appeal to prospective tenants. In the table below, we show an increase of $2,000,000 from Acquisition to Proforma Cost in our example asset. This increase includes the $1,000,000 of additional purchasing costs as well as $1,000,000 of capital expenditures. In the Proforma Income, we also assume that capital expenditures and rising market rents allow NOI to increase by 3 percent to $1,030,000 over the first year after purchase. The resulting Proforma cap rate is a full 0.32 percent lower than the initial Acquisition cap rate.

The Bottom Line
While the Acquisition Cap Rate is simplistic and extremely useful as a benchmark for market trends over time, multifamily investors must be wary of computational differences when comparing individual investment cap rates. Regardless to say, NOI and its calculation are the most important factors when taking cap rates into account.


